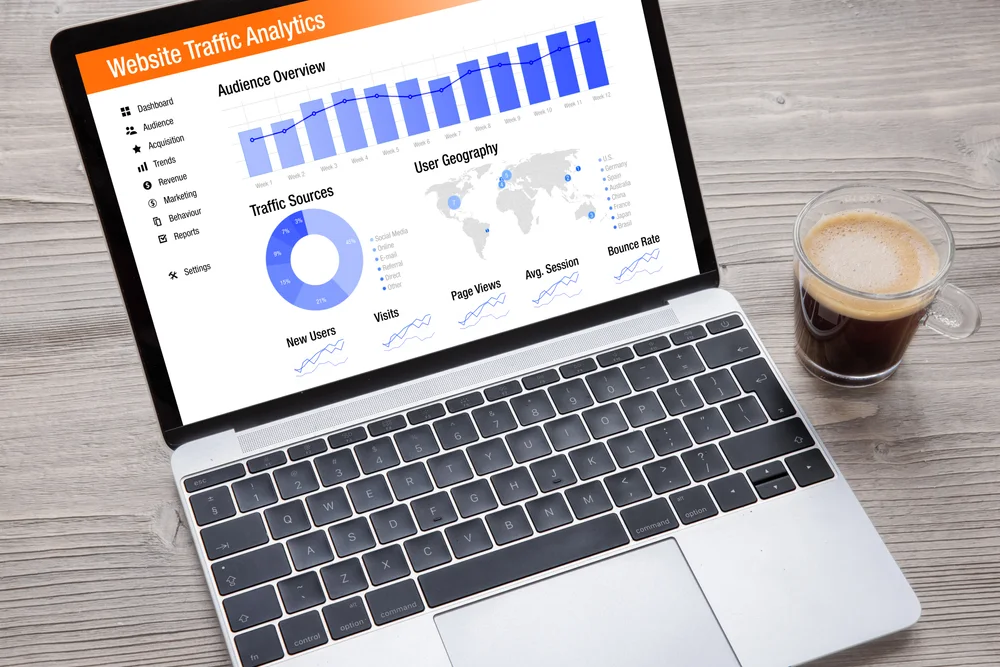
Learning More About Your Visitors
Back in the 1990s, when online shopping first took off, people mostly paid attention to how many visitors a website had. As online marketing matured, we started looking at more than the head count.
Alongside “How many people visited?” we now ask:
- How long did people stay? A shop full of people who walk right back out isn’t doing much business.
- How many people bought something? Just like a physical shop, an online store wants to know how many visitors become buyers.
- How much did it cost to bring each visitor in? When a business pays for advertising, it needs to know whether the visits were worth the money.
Here are two examples:
- Website A has a small number of visitors, but a lot of them buy something.
500 people visit, 40 people buy something = 8% of people buy - Website B has a lot of visitors, but not many of them buy anything.
5000 people visit, 40 people buy something = only 0.8% of people buy
Website A sells just as much with a tenth of the visitors. What visitors do on the site matters as much as how many arrive.
How Much Traffic Does a Website Get?
There is no typical number. A plumber in Grants Pass might see a few hundred visits a month and stay busy, while a national online store needs far more. The right number for your site is the one that brings in enough of the right customers.
To see how many visitors your own website gets, open Google Analytics and look at users and sessions for the last 28 days. Google Search Console shows how many times your pages appeared in Google and how many of those searches turned into clicks. Many hosting companies also offer a visitor report built from the server log.
Curious about a competitor? Tools like Semrush and Similarweb estimate other websites’ traffic from the outside, so treat their numbers as rough guesses. Your own analytics give you the exact count.
How Do We Know Who Visits a Website?
When you visit a website, your computer or phone talks to the website’s server, a bit like a call through a telephone exchange. Each page is made up of many files, and the server sends each one to your device. Every file sent counts as a “hit,” so one page view can produce many hits.
The server tracks every part of the website to see which pages get the most attention. Each visit to the website is called a “session.”
The server records every file request in a “server log.” The log works like a diary of visitor activity and holds a lot of useful information for the website owner.
Understanding website traffic means knowing what visitors do on the site, whether they buy something, and what it costs to get them there. With that, a business can improve its website, give visitors a better experience, and make more money.
Here are the numbers and tools that show you what your traffic is doing.
Bounce Rate, or Who Leaves Right Away
Bounce rate is the percentage of visitors who leave your website after viewing only one page. A high bounce rate usually means visitors didn’t find what they were looking for.
It can point to content that misses the mark, navigation that is hard to follow, or pages that load too slowly.
Find the pages with the highest bounce rates, improve them, and more visitors will stay and explore.
Time on Page and Engagement
The time visitors spend on your pages shows how engaged they are. When people stay and read, they are finding your content useful, and they are more likely to become customers.
When people leave quickly, the page may not match what they expected. Look at the pages where visitors spend the most time and use what works there on the rest of your site.
Conversion Rate, from Visitors to Customers
Conversion rate is the percentage of visitors who take the action you want: buying something, filling out a contact form, or signing up for a newsletter. The higher the rate, the more of your visitors are becoming customers.
To raise it, make the site easy to use, put a clear call to action on every page, and keep the checkout or contact form short. Try one change at a time and watch what happens to the number.
Where Your Visitors Come From
Knowing where your traffic comes from shows you which marketing is working, so you can put your time and budget there. The common sources are:
- Organic search. Visitors who find you in search engine results.
- Referral. Visitors who follow a link to your site from another website.
- Direct. Visitors who type your web address into their browser.
- Social media. Visitors who click a link to your site on a social platform.
- Paid advertising. Visitors who arrive from ads, such as pay-per-click or display campaigns.
Comparing these sources tells you which channels earn their keep.
Tools for Website Traffic Analysis
These are the tools I see businesses use most:
- Google Analytics. A free tool from Google that shows traffic sources, visitor behavior, conversions and more.
- Heatmap tools. Visual maps of where visitors click and scroll, so you can see which parts of a page get attention.
- A/B testing tools. Show two versions of a page to different visitors and see which one earns more engagement and conversions.
- CRM (customer relationship management) systems. Track each customer from their first visit onward, so you can see which traffic turns into long-term customers.
The data from these tools tells you what to improve next on your website.
Improving Your Website’s Results
Understanding website traffic means understanding what visitors do: how they behave, how engaged they are, how many convert, and which marketing brought them in. Those numbers show you where to improve.
A successful website attracts the right audience, keeps them engaged and turns them into loyal customers. Keep reviewing your traffic and improving the site based on what you learn. If you would like help reading your numbers, call or text me at (541) 226-8087.
A Real Report Keeps Search Clicks and Vehicle Sales Separate
Oregon RV Outlet’s Search Console report recorded 662 search clicks and 17,063 impressions from August 13 through September 9, 2026. Those figures describe activity in Google search results. They do not count vehicle sales or establish how many inquiries became customers.
When you review your own report, keep the source, dates, and measure beside the number. Then compare the activity with actual inquiries and your own business records.
See the dated figures and their sources
Source: existing Oregon RV Outlet case study; its report was reviewed September 11, 2026. This is historical evidence, not a current-period result or a new growth claim.
Oregon RV Outlet Turned Its Inventory Into Search Traffic
Every RV on Oregon RV Outlet’s lot has its own page with photos, specifications and a way to call or text about that unit. Those pages give Google something specific to show for each search a shopper makes.
August 13 to September 9, 2026. Clicks and impressions from Google Search Console; organic-search sessions from Google Analytics. These are different measures and are not added together.
One page for every unit on the lot
A shopper searching for a specific trailer can land on the page for that exact trailer, see the photos, and call about it.
See the Oregon RV Outlet project →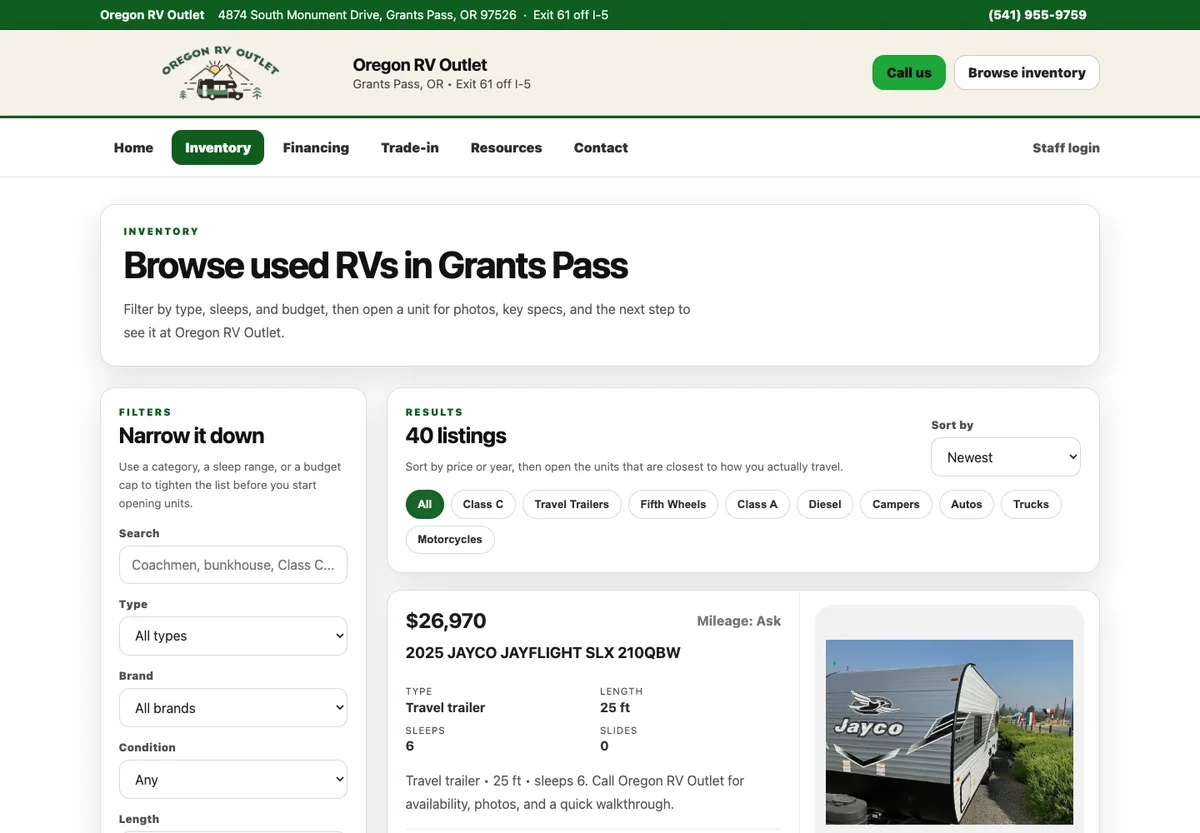
Russco’s Service Pages Show Up for the Jobs People Search
When we researched the excavation market in Douglas County, we built Russco Enterprises a separate page for each of its 12 services and 5 service areas. Search Console shows those individual pages appearing for the jobs people search for.
August 17 to September 13, 2026. Google Search Console web-search totals. Traffic is still modest; impressions count appearances in search results.
A page for every job
A property owner searching for trench digging lands on a page about trench digging, with the equipment, the factors that affect an estimate, and a way to request one.
See the Russco Enterprises project →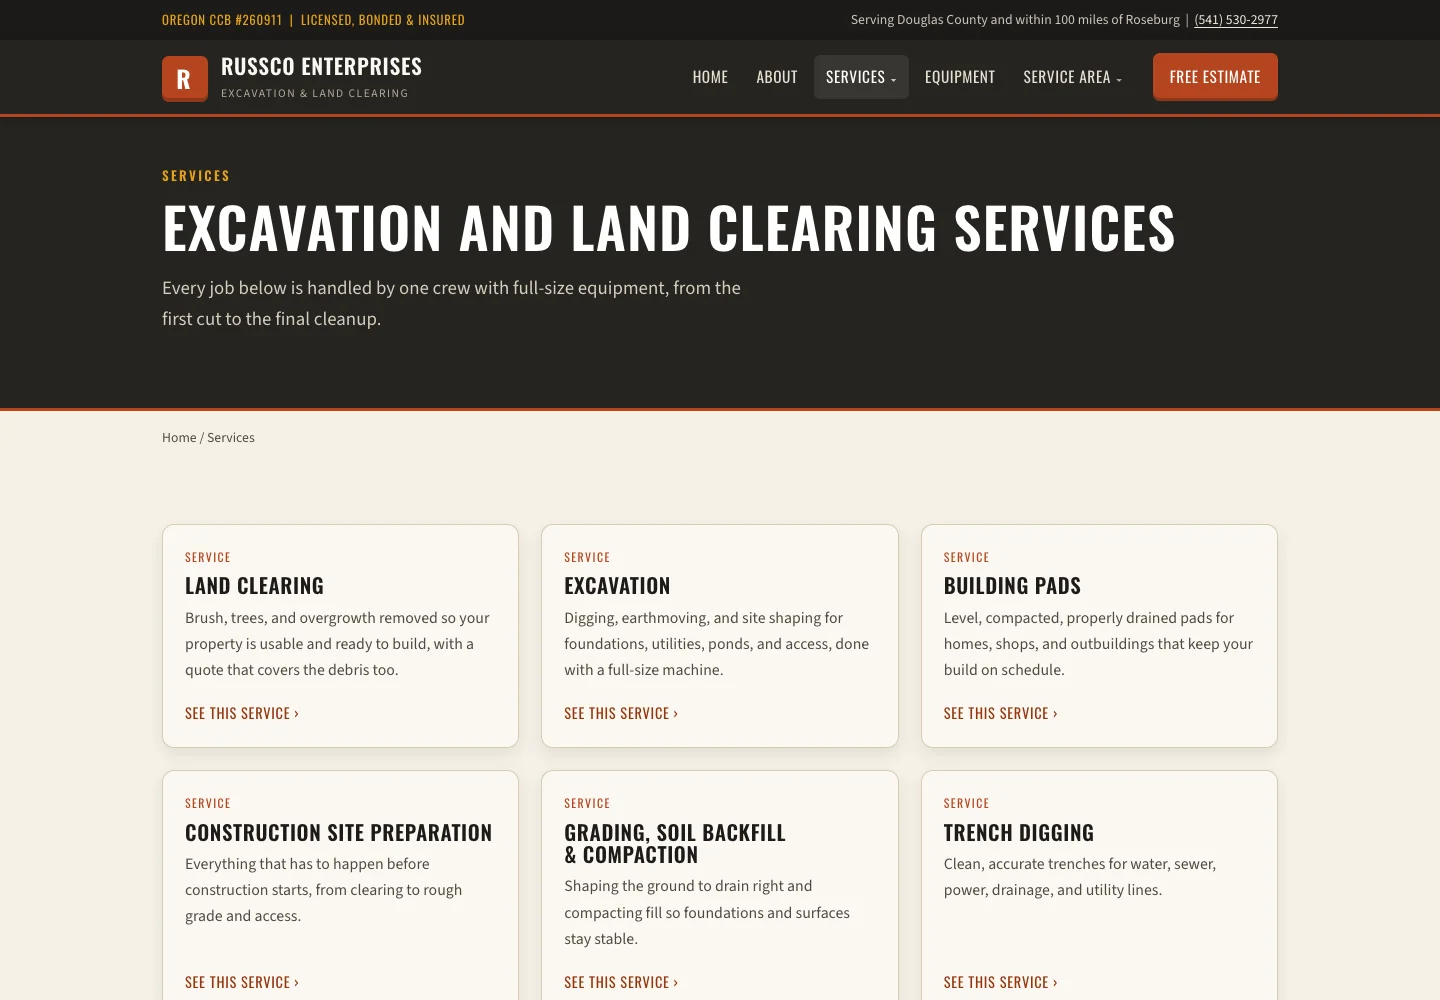

I run Good Creations in Grants Pass. I work directly with business owners on website design, content, and search. My work includes service writing, inventory websites, and custom publishing tools.
Meet Bob